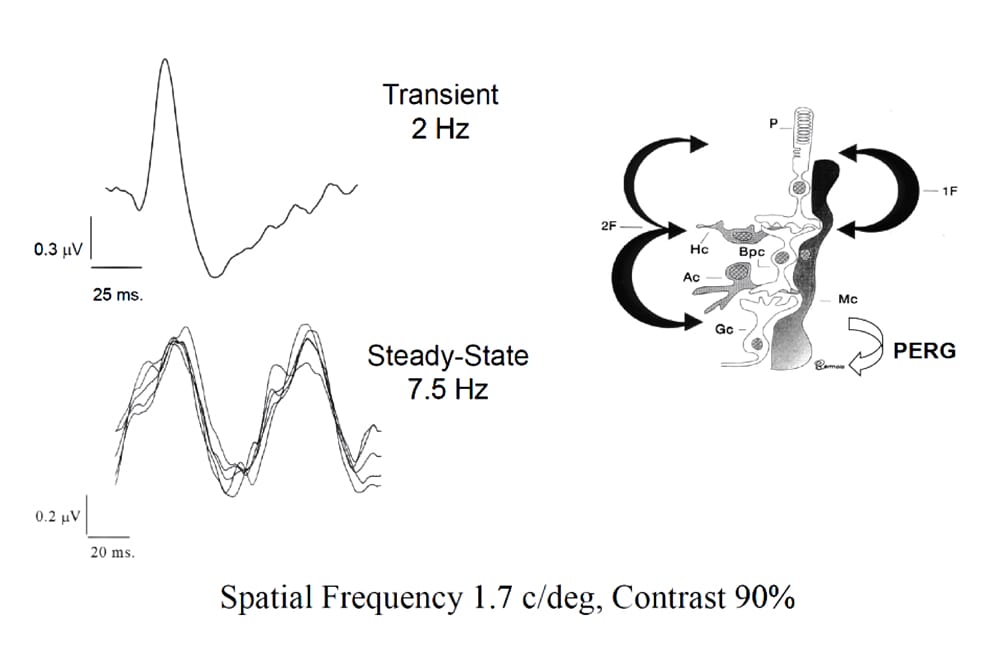
Figure 1. Pattern electroretinogram.
Ophthalmologists frequently ponder the most effective diagnostic examination for screening patients at risk of glaucoma. Professor Benedetto Falsini contends that the pattern electroretinogram (PERG) examination, which provides “non-invasive objective, quantitative measurement of central retinal function”,1 could serve as a key diagnostic tool in the early phase of the disease.
An electroretinography (ERG) test, which measures the response of the retina to light, can be recorded in response to alternating gratings or checkerboards modulated in counterphase at constant mean luminance. The PERG is a particular type of ERG, generated by sinusoidal gratings of moderated contrast, alternated at high temporal frequency (8 Hz). Unlike the ERG, it requires the integrity of innermost retinal layers and specifically of retinal ganglion cells (RCGs) to generate measurements.
In different animal models, and in humans with lesions of the optic nerve and retrograde RGC degeneration, the PERG, unlike the flash ERG, is severely reduced in amplitude and may become non-recordable in a more advanced disease stage. The PERG amplitude loss develops in parallel with the progressive loss of RGCs and optic nerve fibres, and PERG losses can anticipate the loss of optic nerve fibres in early manifest glaucoma. Therefore, the PERG can be a clinical indicator of the loss or dysfunction of RGCs, like in glaucoma or optic neuritis.
The PERG is a focal response representing the contribution of the retinal area directly stimulated.
The Pattern Electroretinogram Recording
The PERG is a focal response representing the contribution of the retinal area directly stimulated. Due to the higher density of RGCs in the macula compared to more peripheral retinal areas, the largest PERG response can be recorded from the central retina. However, the PERG can also record hemifield stimuli, comparing responses from upper and lower hemifields. This approach shows higher diagnostic sensitivity, compared to full-field stimuli, in early glaucoma with localised visual field defects. The normal human PERG, in agreement with RGC physiological properties, displays both temporal and spatial selectivity (tuning functions). As a function of temporal frequency, the response shows its maximum amplitude at 8–10 Hz and, depending on the luminance, a critical fusion frequency at 20–25 Hz. As a function of spatial frequency, the PERG shows its maximum amplitude at intermediate spatial frequencies (1.5–2.5 cycles/degree) with an attenuation at lower and higher frequencies.
The PERG spatial tuning reflects centre-surround antagonistic properties of the RGCs generating the signal. Many neuro-ophthalmologic diseases may affect the properties of RGC receptive fields in an early disease stage, well before the occurrence of neuronal loss, usually induced by apoptosis.
The loss of lateral inhibitory properties of the receptive fields of RGC may result in a shallower tuning of the PERG response.

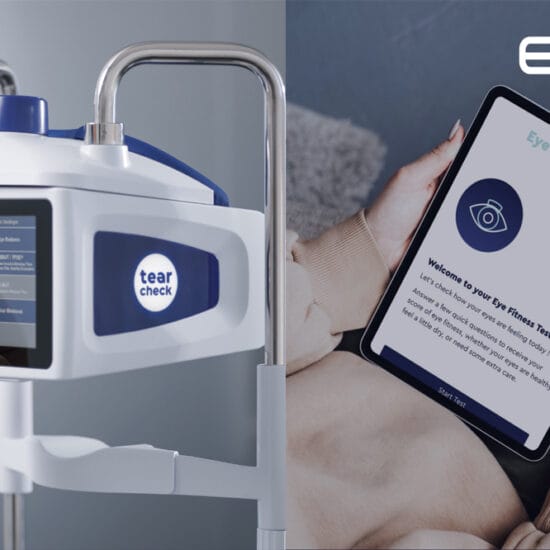
Figure 2. CSO Retimax enables the objective functional evaluation of the visual system, in accordance with the SCEV standard (International Society for Clinical Electrophysiology of Vision). Distributed in Australia by Eyetek, it offers the hemifield PERG test for early diagnosis of glaucoma.
The diseases with altered PERG spatial tuning include early glaucoma, multiple sclerosis (with or without a history of optic neuritis), as well as compressive optic neuropathy. Therefore, the assessment of PERG spatial tuning can be an early, although not specific, indicator of RGC dysfunction (Falsini, personal unpublished observation).
The PERG amplitude increases linearly with contrast, up to the maximum stimulus contrast, thus allowing the estimate of PERG contrast thresholds. As expected from human RGC physiology, the PERG recorded in response to isoluminant red-green gratings (chromatic contrast) displays spatio-temporal characteristics more typical of Parvocellular RGCs, with a low-pass shape of both temporal and spatial tuning, unlike that seen with luminance contrast stimuli.
The PERG properties, reflecting the contribution of the two major RGC sub-populations (magno-and parvocellular), can be exploited to evaluate neuro-ophthalmic disorders with prevalent involvement of one pathway or the other, like optic neuritis (more severe involvement of P-cells) or early glaucoma (more severe involvement of M-cells).
Professor Benedetto Falsini is an Associate Professor Ophthalmology, at IRCCS Università cattolica del Sacro Cuore, Policlinico Gemelli, Rome, Italy.
Reference
- Asanad S, Karanjia R. Pattern electroretinogram. [Updated 2023 Jul 25]. In: StatPearls [Internet]. Treasure Island (FL): StatPearls Publishing; 2024 Jan-. Available at: ncbi.nlm.nih.gov/sites/books/NBK560641/ [accessed Dec 2024].