With the recent approval in Australia of two drugs for the treatment of geographic atrophy (GA) secondary to age-related macular degeneration (AMD), the Australian clinical community can now actively manage – rather than simply monitor – the disease in their patients. In this article, Professor Robyn Guymer and Associate Professor Zhichao Wu discuss how clinicians can best identify those patients who will benefit most from GA treatments.
LEARNING OBJECTIVES
On completion of this CPD article participants should be able to:
- Optimise the certainty of the diagnosis of atrophy being secondary to age-related macular degeneration,
- Identify lesion characteristics that have been associated with a faster rate of geographic growth, and
- Understand the trial outcomes in terms of visual benefit and trial limitations.
Patients with GA secondary to AMD have historically faced an inevitable course of progressive vision loss. Indeed, GA remains a common cause of irreversible vision loss in people over 50 in our community. Estimates suggest that 1–2% of the Australian population over 50 years of age have late-stage AMD, or 100–200,000 people, with half having geographic atrophy (GA).1 However, with the first treatments for GA starting to be used in clinical care in Australia, we are on the cusp of a transformative era for the management of GA. Pivotal trials of pegcetacoplan (OAKS and DERBY)2 and avacincaptad pegol (GATHER2)3 were able to show a slowing in the growth rate of GA lesions in treated eyes compared to sham-treated eyes, thus meeting their primary efficacy outcome. Following on from their approval in the United States, the Therapeutic Goods Administration (TGA) in Australia recently approved these two treatments, Syfovre (pegcetacoplan) and Izervay (avacincaptad pegol).
As a clinical community, we now have an opportunity to move from a monitoring paradigm to more active management of patients with GA. To do this, we need to ensure that we can (1) optimise the certainty that the diagnosis of atrophy is secondary to AMD, and not another disease; (2) be able to identify lesion characteristics that have been associated with a faster rate of growth, as this will help with individualised patient counselling; (3) understand the trial outcomes in terms of visual benefit, and the trial limitations in being able to capture any visual benefit. These skills will help clinicians contextualise their patients within the broad GA landscape, to help identify who, among all the patients with GA, will likely benefit most from treatment.
Identifying Geographic Atrophy
Eyes that develop GA have usually had large drusen and retinal pigment epithelial (RPE) irregularities, seen as hyperpigmentation or depigmentation of the RPE.4 The pattern of GA progression often initially reflects the distribution of these drusen. Thus, GA development often first occurs in the perifoveal area and spares the foveal centre, and later exhibits lesion growth towards the fovea. GA development, however, can also occur at the foveal centre, often after a collapsed pigment epithelial detachment (Figure 1).

Figure 1. FAF images of GA. A, left) A multifocal lesion sparing the central fovea. B, right) GA affecting the central foveal region after a collapsed pigment epithelial detachment.
GA traditionally refers to atrophic changes seen either on clinical fundus examination or on colour fundus photography (CFP), which appear as sharply circumscribed, roughly round or oval areas of atrophy of RPE loss where the underlying choroidal vessels become visible.5 However, with multi-modal imaging (MMI), additional features relating to the GA can be seen. Fundus autofluorescence (FAF) imaging provides high contrast retinal images where the loss of RPE in GA is seen as well-demarcated regions of markedly decreased autofluorescence compared to the background signal.6 FAF is an excellent tool for identifying, quantifying and tracking areas of GA (Figure 2). Indeed, the rate of GA growth derived from FAF images was the approved primary endpoint in the pivotal clinical trials and used to test the efficacy of new treatments.2,3

Figure 2. FAF images of GA increasing in area over successive visits.
FAF can also be used to identify the background hyper-autofluorescence (hyperAF), surrounding the GA lesion, which occurs as a result of the accumulation of fluorophores. Distinctly different patterns of hyperAF are seen and help predict growth characteristics, where a diffuse background hyperAF signals the likelihood of faster growth.7 Importantly, characteristic FAF patterns can be seen in many inherited retinal diseases (IRD), which adds significantly to our ability to differentiate these different diseases.6 For example, the FAF in Stargardt’s disease will have a heightened background autofluorescence, and the deposits will more easily be seen as linear flecks, rather than typical drusen (Figure 3). This distinction becomes ever more important as treatments start to become available, as treatments for IRD will be different to those for GA.

Figure 3. FAF images of A, top) typical geographic atrophy and B, bottom) Stargardt’s disease.
Spectral domain optical coherence tomography (SD-OCT) is an imaging modality with a level of resolution that allows detection of atrophic changes not readily observable on clinical examination.8 These include changes in the outer retina, such as thinning of the outer nuclear layer (ONL), and loss of the external limiting membrane (ELM), ellipsoid layer (EZ), and RPE bands.9 Increased OCT signal transmission into the choroid (hypertransmission) can also be seen when RPE loss occurs. When large enough, these OCT changes will correspond to the same areas of decreased autofluorescence seen on the FAF images, and CFP-defined GA.9 In 2018, the Classification of Atrophy Meeting (CAM) group proposed standard nomenclature based on OCT findings related to the loss of layers involving the photoreceptors and RPE. The terms complete and incomplete RPE and outer retinal atrophy (cRORA and iRORA respectively) were proposed as the OCT signs of atrophy.10,11 On an OCT B-scan, cRORA is defined as (1) a region of hypertransmission ≥250 µm in diameter, (2) a zone of attenuation or disruption of the RPE ≥250 um in diameter, (3) evidence of overlying photoreceptor degeneration, and (4) absence of scrolled RPE or other signs of an RPE tear (Figure 4A).

Figure 4. OCT-B scans. A, left) A region of cRORA. B, right) A region of nGA.
The term nascent geographic atrophy (nGA) was coined in 2014 to describe OCT changes that appeared to portend the future development of GA.12 The outer retinal OCT changes described include the subsidence of the outer plexiform layer (OPL) and inner nuclear layer (INL), and/or the development of a hyporeflective, wedge-shaped band within Henle’s fibre layer (Figure 4B, above). In eyes with large drusen, the development of nGA was associated with a >78-fold increased risk of subsequently developing GA (compared to eyes that did not develop nGA).13
While the treatment of eyes with such early signs of OCT-defined atrophy is not currently approved nor recommended, identification of those with such high-risk features for future GA development could trigger a different conversation about the potential treatments becoming available, compared to the counselling of those without such high-risk signs. Hopefully, as treatments become more efficacious, safe, and easy-to-deliver, it will be possible to start treatments when the first signs of atrophy develop, to limit the amount of retinal tissue lost.
Characteristics Suggestive of More Rapid Growth Rate
There is considerable heterogeneity in lesion growth rate in GA, with one study reporting a range from 0.53 to 2.6 mm2/year.14 Understanding lesion characteristics, or biomarkers, that help predict an individual’s growth rate is an important consideration when looking at the potential value of treatment. Knowing the previous growth rate, through having collected appropriate imaging (FAF and OCT scans) during prior visits, is perhaps the best way to predict the future growth rate. However, not everyone would have such prior imaging available, and so risk stratification based on characteristics from retinal imaging at the time of presentation may be necessary. Using MMI, characteristics that are currently thought to be associated with an increased risk of faster GA growth are related to the number, size, and location of the GA lesions, the background autofluorescence pattern, and the presence of reticular pseudodrusen (RPD).
Slower GA growth rates are seen when baseline lesions are small, unifocal (compared to multifocal), and are located at the fovea (compared to extrafoveally).14,15 Data from OAKS and DERBY trials found that as the distance from the foveal centre increased, so too did the rate of the lesion growth.16 Similarly, data from these trials found that the smaller the circularity index (a measure of the regularity of the GA lesions), the faster the rate of growth.16 The status of both eyes is also important, with growth rates appearing to be faster when the fellow eye also has GA.17
OCT allows for other relevant biomarkers to be identified, such as the presence of RPD, which are deposits located above the RPE, and are distinct from conventional drusen, which are located below the RPE.18 AMD eyes with GA and RPD have been found to have more rapid GA growth than those without RPD, and GA lesions appear to grow faster in the actual region that has RPD.19,20 On OCT B-scans, disruption of the photoreceptor ellipsoid zone (EZ) has also been reported as a possible biomarker for predicting the location of future GA progression.21 Now with AI algorithms, the difference or ratio between the extent of EZ and RPE loss can be calculated, with a larger difference or ratio (i.e., greater EZ compared to RPE loss) potentially indicative of faster growth.22 Regulatory-approved AI algorithms can now be accessed via payment – where scans can be uploaded to portals, and a report received on parameters such as the EZ-RPE difference or EZ/RPE ratio. These parameters are now being used as inclusion criteria for some current trials in GA. OCT imaging can also more definitely identify how close the atrophic lesion is to the foveal centre point, which is not so precise with FAF imaging, given the blocking of the autofluorescence signal around the fovea from the overlying luteal pigment.
A sub-phenotype of GA patients with rapid growth, that is now topical and of great research interest, is called extensive macular atrophy with pseudodrusen-like appearance (EMAP). This sub-phenotype of GA was first described in 2009 and can present in younger patients, typically in the fifth decade, and is characterised by bilateral, symmetric, well-circumscribed, often extensive, macular atrophy surrounded by diffuse reticular pseudodrusen, often with a lack of conventional drusen.23 The periphery can show paving-stone degeneration.23,24 GA growth for eyes with this sub-phenotype is often faster than those without, with one estimation being 2.9 mm2/year, and with lesion growth occurring in a more vertical direction (often extending past the temporal arcades).25 The atrophic lesions tend to show a lesser degree of decrease in autofluorescence, which is thought to be due to the thickened basal laminar deposit at the level of the RPE26 (Figure 5). The OCT has a characteristic diffuse separation between the RPE Bruch membrane (BM), resulting in a thin ‘double layer sign’, again thought to implicate the presence of basal laminar deposits.24 There is an active research program in EMAP underway at the Centre for Eye Research Australia, and we would be very keen to see any such cases (amd-studies@cera.org.au).

Figure 5. FAF images of a case of extensive macular atrophy with pseudodrusen-like appearance (EMAP) – a sub-phenotype of GA. Note the vertical direction of growth, the trickling background fluorescence pattern, and the lesser degree of decrease in autofluorescence of the atrophic lesion.
Integrated, Image, Diagnostic and Education Centre
In recent surveys involving both optometrists and ophthalmologists, it was clear that clinicians were keen to receive more education relating to the identification and management of GA.27,28 To this end, the Macular Research Unit under the author Professor Robyn Guymer at the Centre for Eye Research Australia (CERA) is working to establish an Integrated, Image, Diagnostic and Education Centre (IIDEC), whereby clinicians seeing people with GA, who would like an opinion on the GA lesion characteristics, can upload images and receive a report. OCT volume scans, as well as FAF images, will be able to be uploaded and sent securely into the IIDEC portal at CERA, after which a report will be generated identifying the certainty in diagnosis and key imaging features that help determine GA growth rates. This information can thus help clinicians counsel their patients and help inform their decision making around referral for possible treatment, or indeed commencement of treatment.
Visual Function in Geographic Atrophy
The impact of GA on a person’s visual function and quality of life varies considerably, as not all GA lesions are equally impactful. The imminent threat to the fovea, and thus central vision, depends primarily upon distance from the fovea and the direction of growth. While traditionally, visual acuity (VA) has been the main metric to determine visual function in all AMD studies, it is not a useful measure in GA. Indeed, while the pivotal trials OAKS and DERBY and GATHER2 demonstrated reductions in GA growth rates, they were unable to show any significant treatment effect for VA.2,3 As a fovea-centred measure, VA is widely recognised as limited in its ability to reflect the overall functional impact of GA.29,30 VA correlates poorly with total CFP-defined GA area (R2=0.07), and only demonstrates a stronger association when CFP-defined GA involves the central 1 mm diameter region (R2=0.45).31 Indeed in the OAKS and DERBY trials, no prespecified visual function endpoints, including reading speed (also a foveal test) and threshold-based mean visual sensitivity on microperimetry, nor patient-reported outcomes, showed any significant treatment effect, and all had weak correlations with changes in GA extent.2,3,32
However, there are important factors to consider when interpreting the above lack of significant treatment effect on mean visual sensitivity on microperimetry. First, testing was performed using a conventional threshold-based approach, where multiple stimuli were presented at specific test locations to determine visual sensitivity thresholds. To maintain acceptable test durations, only a limited number of retinal locations can be tested. It is well recognised that there is substantial measurement variability in areas of reduced visual sensitivity with such threshold-based testing, which hampers accurate measurements of visual sensitivities in eyes with GA.34,35 As a result, only weak correlations are observed between GA extent and both mean sensitivity and the number of absolute scotomas with conventional microperimetry.36 Furthermore, clinical trials powered to detect treatment effects on the structural endpoint of GA growth would thus have been underpowered to detect treatment effects on preserving visual function derived from conventional threshold-based microperimetry, given its measurement variability. It may well be possible that the pivotal trial design was not large enough to detect treatment-related benefits on such functional outcomes.
Optimising Visual Sensitivity Loss Assessment
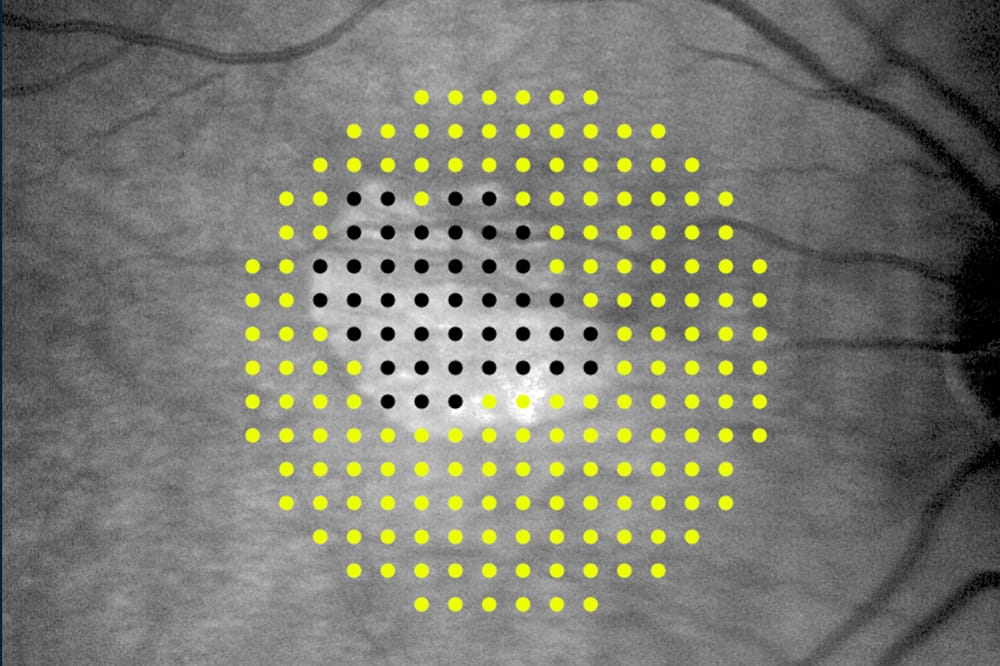
Areas of GA are characterised by profound visual sensitivity loss and visual sensitivity declines precipitously at the GA margin.37,38 Therefore, a testing strategy optimised to quantify the extent of deep sensitivity loss may be more efficient at detecting benefits of interventions that are not effectively captured by conventional threshold-based approaches. One strategy that we have proposed is referred to as ‘defect-mapping microperimetry’ (DMP), which involves single stimulus presentations of suprathreshold stimuli39,40 (Figure 6). This approach allows assessment of a substantially larger number of retinal locations within an acceptable testing time (of around six minutes) than possible with conventional threshold-based testing of the same test duration. DMP testing can now be performed on the recently released iCare MAIA3 (Macular Integrity Assessment) device (Centervue S.p.A. Padova, Italy).

Figure 6. Comparison of A) standard threshold-based microperimetry, conducted over 68 points, and B) DMP, which uses single suprathreshold stimuli presentations at 208 points, in eyes with geographic atrophy.
Using this approach, DMP has been shown to be more effective at capturing progressive enlargement of deep scotomas than conventional threshold-based microperimetry. Additionally, there is a strong structure-function relationship between GA extent and the proportion of locations missed on DMP (Spearman correlation coefficient, 0.90).39,40 In longitudinal analyses, there were moderate correlations between changes in GA extent and changes in the proportion of missed locations on DMP over 12 months and 24 months (Spearman correlation coefficients, 0.68 and 0.87, respectively).41 Indeed, focusing the analysis only on the subsets of test locations immediately adjacent to those locations that do not respond, potentially gives the best analysis strategy to detect change over time.42 Currently, an intense international effort is being made to determine the best microperimetric testing and analysis strategy to optimise the chance of finding an intervention that does indeed lead to better visual functional outcomes.
Conclusion
We will now start to see patients with GA begin what is currently a life-long treatment, requiring ongoing intravitreal injections to slow the growth of GA, with the aim to preserve central (ideally foveal) vision for as long as possible.
All treatments have side effects and so knowing that these treatments carry the same risk as any anti-vascular endothelial growth factor (VEGF) treatment (such as infection, lens injury, retinal detachment), as well as additional risks, is important. Both drugs can be associated with inflammation, but pegcetacoplan, in particular, has been linked to rare cases of occlusive retinal vasculitis, which may have dire consequences for the eye. This is a rare complication but occurs most commonly on the first injection, and the mean time for symptoms to occur is seven to 10 days after an injection.43 If concerned about this complication, patients should be sent for urgent care. In addition, eyes receiving either drug (but more so with pegcetacoplaan) have a risk of developing neovascular AMD (nAMD). As such, these patients still need to know to report immediately any sudden changes in vison and be monitored with OCT scans. Anyone with sudden changes in vision should be seen to determine if they have developed nAMD and thus need to be treated.
Intense research is ongoing to find other efficacious and safe treatments for GA. Several GA trials in various phases of development are currently being, or will soon be, undertaken in Australia. Some of these novel interventions are being given by other forms of administration apart from intravitreal injections, such as orally and subcutaneously. Thus, while we have our first treatments available, they will not be the last to be developed. Support for clinical trials and allowing our own patients with GA to access potentially efficacious novel treatments, often years before they become widely available, is not only critical for new drug developments, but gives our patients a unique opportunity to contribute, and possibly benefit, from this access.
This article was sponsored by iCare Australia.
 Robyn Guymer AM MBBS PhD FRANZCO FAHMS is Professor of Ophthalmology at Melbourne University and a deputy director of the Centre for Eye Research Australia. She is a senior retinal specialist at the Royal Victorian Eye and Ear Hospital, and a clinician scientist who leads a team of researchers primarily investigating age-related macular degeneration.
Prof Guymer has co-authored over 450 peer-reviewed papers. She is currently investigating new strategies for treating early stages of AMD and is working to identify novel imaging, functional biomarkers, and surrogate endpoints to improve the feasibility of conducting early intervention trials. She has been a principal investigator in many industry-sponsored trials, serves on several pharmaceutical advisory boards, and is a member of several international working groups on macular diseases.
 Associate Professor Zhichao Wu BOptom PhD is a clinician-scientist and leads Centre for Eye Research Australia’s clinical biomarkers research. His work focuses on expediting the discovery of new treatments and ways to prevent irreversible vision loss from conditions such as AMD and glaucoma.
References
- Keel S, Xie J, Dirani M, et al. Prevalence of age-related macular degeneration in Australia: The Australian National Eye Health Survey. JAMA Ophthalmol. 2017;135:1242-49. doi: 10.1001/jamaophthalmol.2017.4182.
- Heier JS, Lad EM, Wykoff CC, et al; OAKS and DERBY study investigators. Pegcetacoplan for the treatment of geographic atrophy secondary to age-related macular degeneration (OAKS and DERBY): Two multicentre, randomised, double-masked, sham-controlled, phase 3 trials. Lancet 2023;40 (104111): 1434- 1434-1448. doi: 10.1016/S0140-6736(23)01520-9.
- Khanani AM, Patel SS, Jaffe GJ, et al; GATHER2 trial investigators. Efficacy and safety of avacincaptad pegol in patients with geographic atrophy (GATHER2): 12-month results from a randomised, double-masked, phase 3 trial. Lancet. 2023;402(10411):1449-1458. doi: 10.1016/S0140-6736(23)01583-0.
- Sarks JP, Sarks SH, Killingsworth MC. Evolution of geographic atrophy of the retinal pigment epithelium. Eye (London, England). 1988;2 (Pt 5):552-77. doi: 10.1038/eye.1988.106.
- Schmitz-Valckenberg S, Sadda S, et al; CAM (Classification of Atrophy Meeting)-Group. Geographic atrophy: semantic considerations and literature review. Retina. 2016; 36(12): 2250-2264. doi: 10.1097/IAE.0000000000001258.
- Schmitz-Valckenberg S, Pfau M, Holz FG, et al. Fundus autofluorescence imaging. Prog. Retin. Eye Res.2020;81:100893. doi: 10.1016/j.preteyeres.2020.100893.
- Holz FG, Bindewald-Wittich A, Schmitz-Valckenberg S, et al. FAM-Study Group. Progression of geographic atrophy and impact of fundus autofluorescence patterns in age-related macular degeneration. Am J Ophthalmol. 2007 Mar;143(3):463-72. doi: 10.1016/j.ajo.2006.11.041.
- Keane PA, Patel PJ, Tufail A, et al. Evaluation of age-related macular degeneration with optical coherence tomography. Surv Ophthalmol. 2012 Sep;57(5):389-414. doi: 10.1016/j.survophthal.2012.01.006.
- Schmitz-Valckenberg S, Fleckenstein M, Holz FG, et al. Optical coherence tomography and autofluorescence findings in areas with geographic atrophy due to age-related macular degeneration. Invest Ophthalmol Vis Sci. 2011 Jan 5;52(1):1-6. doi: 10.1167/iovs.10-5619.
- Sadda SR, Guymer R, Staurenghi G, et al. Consensus definition for atrophy associated with age-related macular degeneration on OCT: Classification of Atrophy Report 3. Ophthalmology. 2018 Apr;125(4):537-548. doi: 10.1016/j.ophtha.2017.09.028. Epub 2017 Nov 2. Erratum in: Ophthalmology. 2019 Jan;126(1):177. doi: 10.1016/j.ophtha.2018.10.038.
- Guymer RH, Rosenfeld PJ, Sadda SR, et al. Incomplete retinal pigment epithelial and outer retinal atrophy in age-related macular degeneration: Classification of atrophy meeting report 4. Ophthalmology. 2020 Mar;127(3):394-409. doi: 10.1016/j.ophtha.2019.09.035.
- Wu Z, Luu CD, Guymer RH, et al. Optical coherence tomography-defined changes preceding the development of drusen-associated atrophy in age-related macular degeneration. Ophthalmology. 2014 Dec;121(12):2415-22. doi: 10.1016/j.ophtha.2014.06.034.
- Wu Z, Luu CD, Guymer RH, et al. Prospective longitudinal evaluation of nascent geographic atrophy in age-related macular degeneration. Ophthalmol Retina. 2020 Jun;4(6):568-575. doi: 10.1016/j.oret.2019.12.011.
- Fleckenstein M, Mitchell P, Ferrara D, et al. The progression of geographic atrophy secondary to age-related macular degeneration. Ophthalmology. 2018 Mar;125(3):369-390. doi: 10.1016/j.ophtha.2017.08.038.
- Schmitz-Valckenberg S, Sahel JA, Holz FG, et al. Natural history of geographic atrophy progression secondary to age-related macular degeneration (Geographic Atrophy Progression Study). Ophthalmology. 2016 Feb;123(2):361-368. doi: 10.1016/j.ophtha.2015.09.036.
- Sadda S, Schwartz R, Tsuboi M, et al. Baseline characteristics associated with geographic atrophy progression in the OAKS and DERBY trials. Abstract presented at the 43rd Annual Scientific Meeting of the American Society of Retina Specialists in Long Beach, CA, July 30-August 2, 2025.
- Fleckenstein M, Schmitz-Valckenberg S, Holz FG, et al; FAM Study Group. Progression of age-related geographic atrophy: role of the fellow eye. Invest Ophthalmol Vis Sci. 2011 Aug 22;52(9):6552-7. doi: 10.1167/iovs.11-7298.
- Greferath U, Guymer RH, Fletcher EL, et al. Correlation of histologic features with in vivo imaging of reticular pseudodrusen. Ophthalmology. 2016 Jun;123(6):1320-31. doi: 10.1016/j.ophtha.2016.02.009.
- Wu Z, Fletcher EL, Guymer RH, et al. Reticular pseudodrusen: A critical phenotype in age-related macular degeneration. Prog Retin Eye Res. 2022 May;88:101017. doi: 10.1016/j.preteyeres.2021.101017.
- Marsiglia M, Boddu S, Smith RT, et al. Association between geographic atrophy progression and reticular pseudodrusen in eyes with dry age-related macular degeneration. Invest Ophthalmol Vis Sci. 2013 Nov 8;54(12):7362-9. doi: 10.1167/iovs.12-11073.
- Giocanti-Auregan A, Tadayoni R, Cohen Sy, et al. Predictive value of outer retina en face OCT imaging for geographic atrophy progression. Invest Ophthalmol Vis Sci. 2015 Dec;56(13):8325-30. doi: 10.1167/iovs.14-15480.
- Schmidt-Erfurth U, Mai J, Bogunovic H, et al. Disease activity and therapeutic response to pegcetacoplan for geographic atrophy identified by deep learning-based analysis of OCT. Ophthalmology. 2025 Feb;132(2):181-193. doi: 10.1016/j.ophtha.2024.08.017.
- Hamel CP, Meunier I, Puech B, et al. Extensive macular atrophy with pseudodrusen-like appearance: a new clinical entity. Am J Ophthalmol. 2009 Apr;147(4):609-20. doi: 10.1016/j.ajo.2008.10.022.
- Romano F, Cozzi M, Salvetti AP, et al. Natural course and classification of extensive macular atrophy with pseudodrusen- like appearance. Retina. 2022;43:402–411. doi: 10.1097/IAE.0000000000003683.
- Carlà MM, Giannuzzi F, Rizzo S, et al. Extensive macular atrophy with pseudodrusen-like appearance: comprehensive review of the literature Graefe’s Archive Clin & Exp Ophthal. 2024;262:3085–3097 doi: 10.1007/s00417-024-06600-z.
- Fleckenstein M, Schmitz-Valckenberg S, Lindner M, et al. Fundus Autofluorescence In Age-Related Macular Degeneration Study Group. The diffuse-trickling fundus autofluorescence phenotype in geographic atrophy. Invest Ophthalmol Vis Sci 2014; 55:2911–2920. doi: 10.1167/iovs.13-13409.
- Guymer RH, Hunyor AP, Abbott CJ, et al. Readiness of optometrists in the management of geographic atrophy: a survey of optometrists in Australia. Clin. Exp. Optom. 2026;109(1):60-66. Epub 2025 Apr 2. doi: 10.1080/08164622.2025.2458171.
- Guymer RH, Cohn AC. Are ophthalmologists ready to manage geographic atrophy? Results from a national survey. Clin. Exp. Optom. 2026:0-4 in press doi: 10.1111/ceo.70060.
- Sunness JS, Rubin GS, Haselwood D, et al. Visual function abnormalities and prognosis in eyes with age-related geographic atrophy of the macula and good visual acuity. Ophthalmology. 1997;104(10):1677-1691. doi: 10.1016/s0161-6420(97)30079-7.
- Sunness JS, Rubin GS, Zuckerbrod A, Applegate CA. Foveal-sparing scotomas in advanced dry age-related macular degeneration. J Vis Impair Blind. 2008;102(10):600-610. PMCID: PMC2836024.
- Shen LL, Sun M, Del Priore LV, et al. Relationship of topographic distribution of geographic atrophy to visual acuity in nonexudative age-related macular degeneration. Ophthalmol Retina. 2021;5(8):761-774. doi: 10.1016/j.oret.2020.11.003.
- Wu Z, Steffen V, Guymer RH, et al. Reading performance in geographic atrophy: comparison of different reading speed measures for capturing longitudinal changes. Ophthalmol Sci. 2024;5(3):100700. doi: 10.1016/j.xops.2024.100700.
- Pfau M, Jolly JK, Schmitz-Valckenberg S, et al. Fundus-controlled perimetry (microperimetry): application as outcome measure in clinical trials. Prog Retin Eye Res. 2021;82:100907. doi: 10.1016/j.preteyeres.2020.100907.
- Pfau M, Lindner M, Schmitz-Valckenberg S, et al. Effective dynamic range and retest reliability of dark-adapted two-color fundus-controlled perimetry in patients with macular diseases. Invest Ophthalmol Vis Sci. 2017;58(6):BIO158-BIO167. doi: 10.1167/iovs.17-21454.
- Wu Z, Hadoux X, Guymer RH, et al. Systematic underestimation of visual sensitivity loss on microperimetry: implications for testing protocols in clinical trials. Transl Vis Sci Technol. 2023;12(7):11. doi: 10.1167/tvst.12.7.11.
- Heier JS, Pieramici D, Guymer R et al; Chroma and Spectri Study Investigators, Visual function decline due to geographic atrophy: results from the Chroma and Spectri phase 3 trials. Ophthalmol Retina. 2020;4(7):673-688. doi: 10.1016/j.oret.2020.01.019.
- Sunness JS, Schuchard RA, Haselwood DM, et al. Landmark-driven fundus perimetry using the scanning laser ophthalmoscope. Invest Ophthalmol Vis Sci. 1995;36(9):1863-1874. PMCID: PMC2719883.
- Hariri AH, Tepelus TC, Sadda SR. et al. Retinal sensitivity at the junctional zone of eyes with geographic atrophy due to age-related macular degeneration. Am J Ophthalmol. 2016;168:122-128. doi: 10.1016/j.ajo.2016.05.007.
- Wu Z, Cimetta R, Caruso E, Guymer RH. Performance of a defect-mapping microperimetry approach for characterizing progressive changes in deep scotomas. Transl Vis Sci Technol. 2019;8(4):16. doi: 10.1167/tvst.8.4.16.
- Wu Z, Hadoux X, Guymer RH, et al. Visual sensitivity loss in geographic atrophy: structure-function evaluation using defect-mapping microperimetry. Invest Ophthalmol Vis Sci. 2024;65(1):36. doi: 10.1167/iovs.65.1.36.
- Saeed A, Guymer RH, Hadoux X, et al. Longitudinal changes of visual sensitivity with geographic atrophy progression assessed by defect-mapping microperimetry. Invest Ophthalmol Vis Sci. 2024;65(14):13.doi: 10.1167/iovs.65.14.13.
- Saeed A, Guymer RH, Wu Z, et al. Customized evaluation of progressive visual sensitivity loss in geographic atrophy to improve the power of clinical trials. Ophthalmol Sci. 2025;5(4):100763. doi: 10.1016/j.xops.2025.100763.
- Kailani Z, Mihalache A, Muni RH, et al. Ocular adverse events associated with pegcetacoplan and avacincaptad pegol for geographic atrophy: a population-based pharmacovigilance study. Am J Ophthal 2025 Aug 1;276:252-60. doi: 10.1016/j.ajo.2025.04.022.